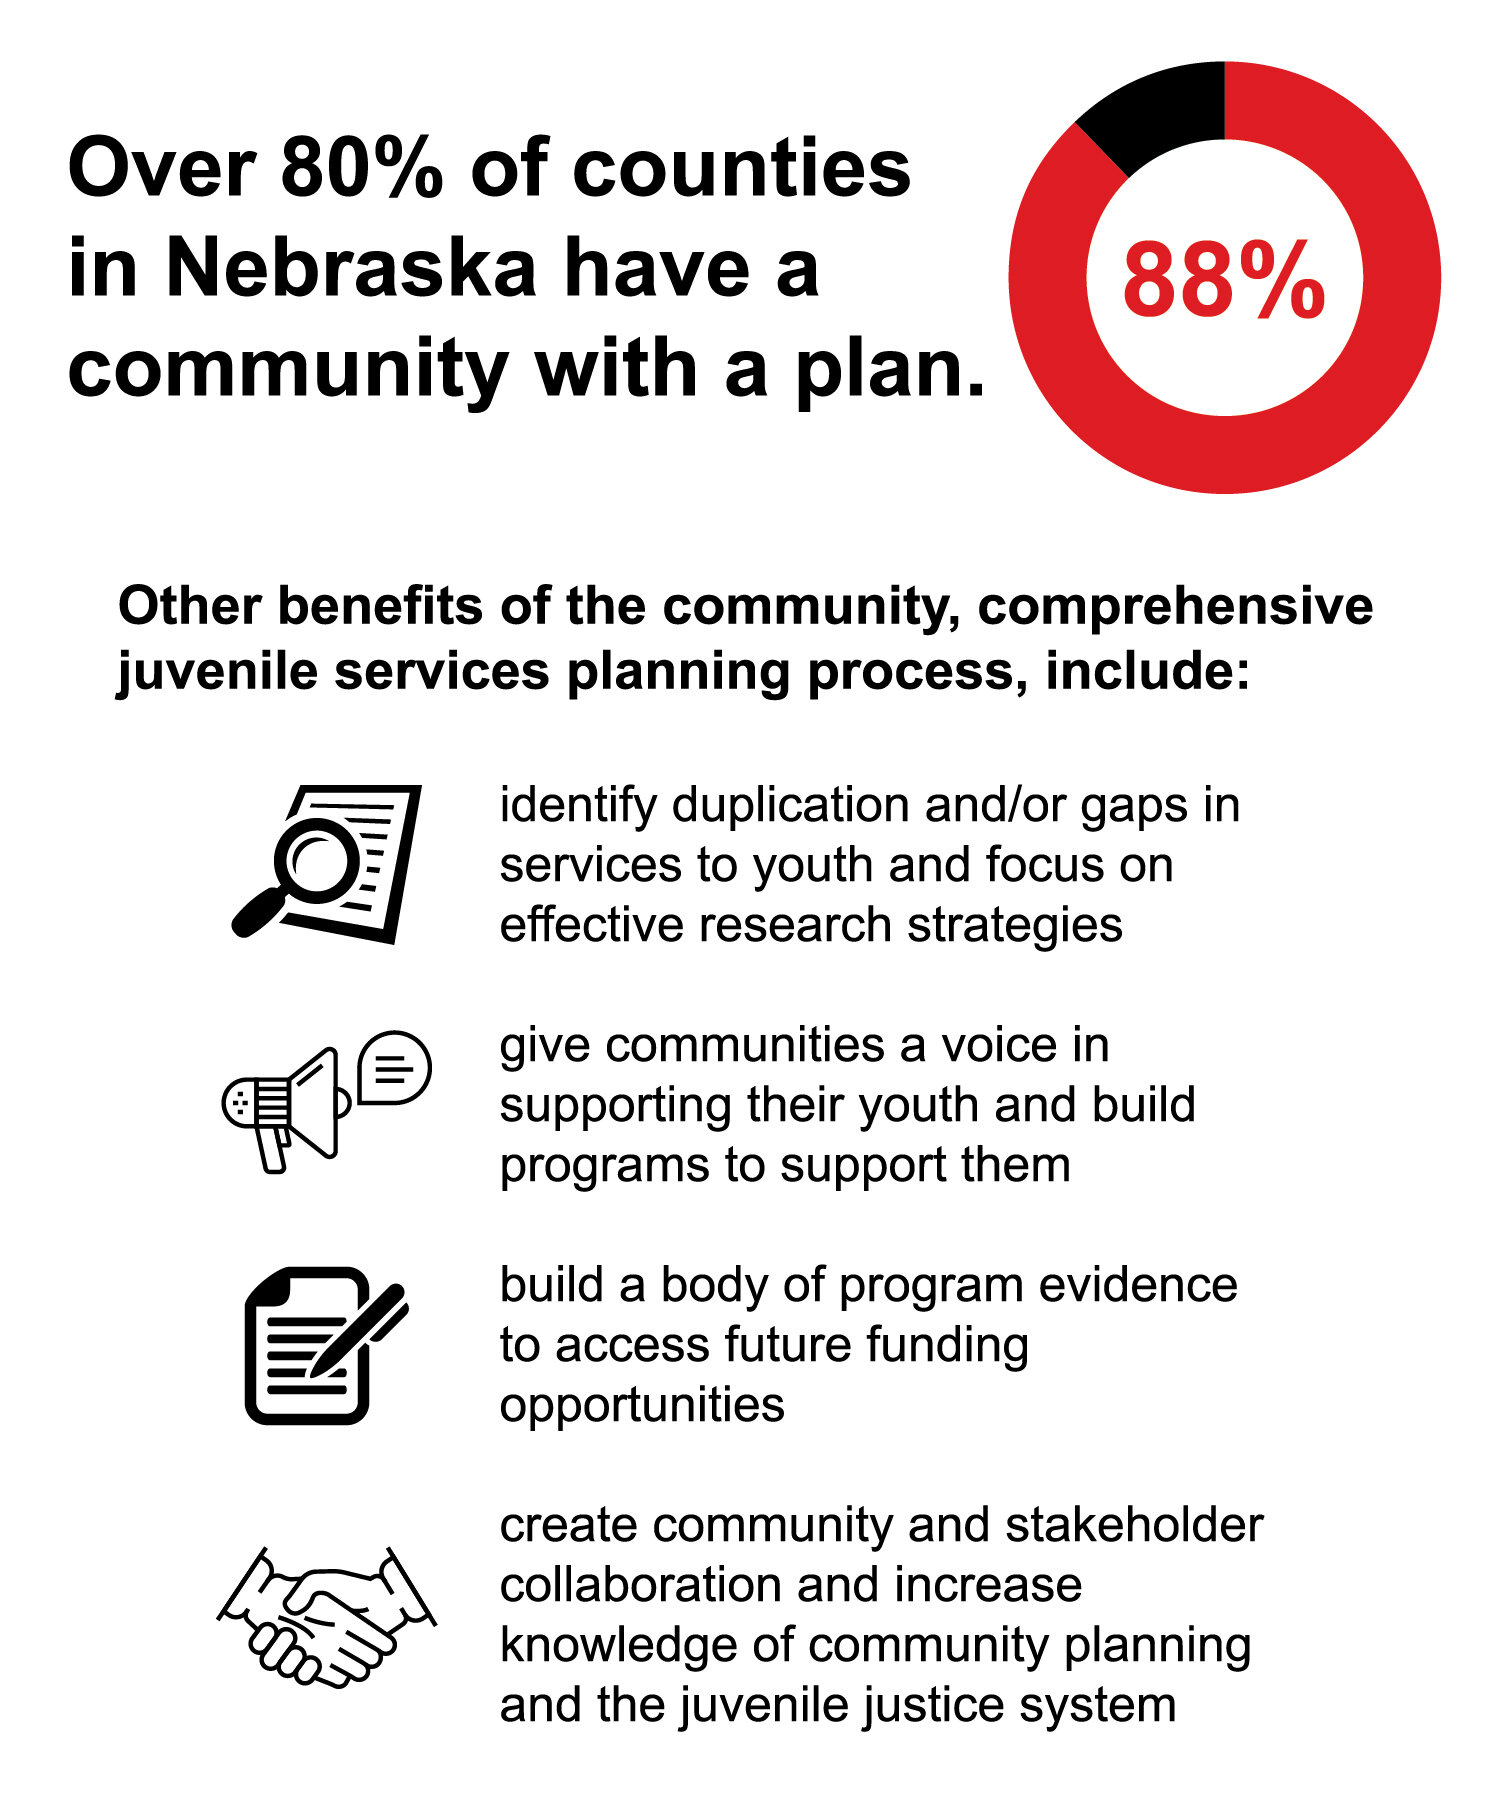
Data Snacks: JCMS data entry processes are important!

Data Entry Processes for JCMS Evaluations

The quality of the Evidence-based Nebraska juvenile justice program evaluations rely on the assumption that program staff are utilizing common definitions when gathering and entering data, and that the data entered is accurate. One method for ensuring accuracy is for programs to employ the best process for data entry.
As part of the JCMS Definition and Data Fidelity (JDDF) Project, we examined data entry processes for the Juvenile Case Management System. Below are some highlights from what we learned.

Data Snacks22.jpg

JJI staff recommend the service provider enter their data to reduce data sharing and having to request data not initially provided. We also recommend using forms that match the JCMS so that these variables can be collected from the beginning. The JJI has created a form for each screen in the JCMS.

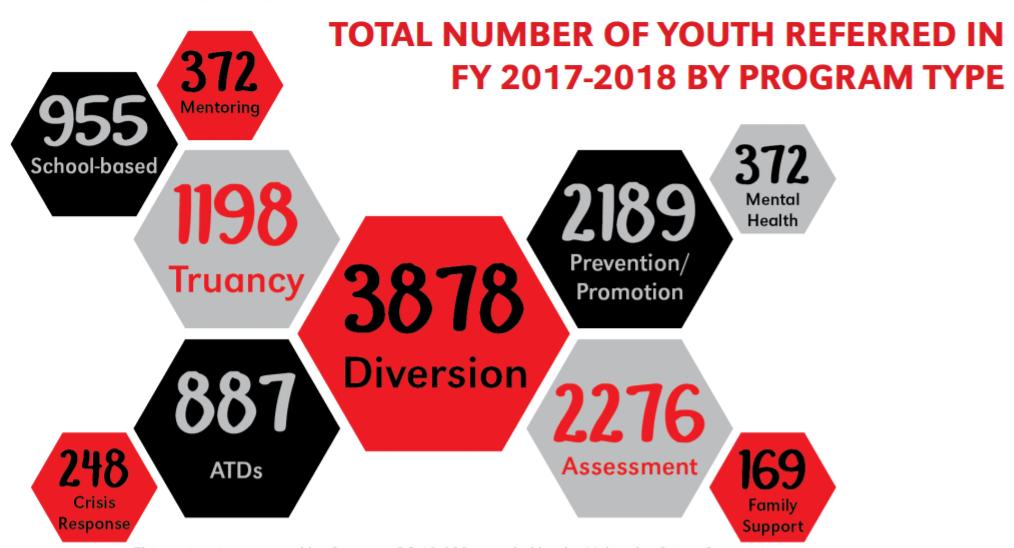
Data by program type and each program are available in the Evidence-based Nebraska annual report.

Data Snacks: JJI Releases Annual Report

JJI Annual Report cover mockup.png

JJI is excited to share the release of our 2020-21 Annual Report for Evidence-Based Nebraska. This year's report highlights the Juvenile Case Management System Definitions and Data Fidelity Project (JDDF Project).

In this report we share the outcomes of the project and important insights into why programs may have received the results they did and suggestions for improving data entry.

JJI Annual Report inside pages.png

Watch for more data snacks later this month highlighting key findings of the report.
You can access the full report on our website.

Data Snacks: Risk Factors of Youth in Nebraska School Interventionist Programs

According to the seminal meta-analysis by Lipsey (2009) that examined the primary factors that characterize effective interventions with juvenile offenders, the most effective interventions are therapeutic and of high quality, and serve youth of the highest risk level, including whether they have prior law violations, have a history of aggressive behaviors, and/or come from a high-risk environment.

According to JJI’s recent analysis of School Interventionist programs, while a small percentage referred had prior law violations, more youth had aggressive behavior and came from a high-risk environment. Please visit our website to read the full report and view data by individual program.

Data Snacks20.jpg

Reference: Lipsey (2009). The primary factors that characterize effective interventions with juvenile offenders: A meta-analytic overview. Victims & Offenders, 4, 124-147

Data Snacks: Success of School Interventionists

School Interventionists are responsible for addressing a range of school and home issues, and often use a range of activities to do so. These activities fall within three identified evidence-based practices including: building social and emotional competencies, focusing on protective factors to improve school engagement, and being a supportive adult and building relationships with youth they serve.

In Nebraska, there have been eight School Interventionist programs funded under community-based aid state grant funds.

Data Snacks19.jpg
 

Read the full report on school interventionists.

Data Snacks: Youth with Adults in Their Lives

National best practice finds that justice involved youth experience better outcomes when they have strong positive relationships with adults in their lives, including system professionals.

Each year, Nebraska schools can participate in the Nebraska Risk Protective Factor Student Survey which asks students in 8th, 10th, and 12th grade questions about the risk and protective factors in their lives.

The Juvenile Justice Institute provided data about youth relations from the most recent survey in 2018, to counties in their Community Needs Assessments to support community planning.

Data Snacks18.jpg

Action Step:

Only 46 of the 93 counties participated in the NRPFSS in 2018. Encourage your community and school to engage in this survey in the future. This important data can help guide necessary programs and interventions to youth in your community.

Data Snacks: Racial Disparities in Juvenile Justice System

An except from The Annie E. Casey Foundation's recent blog post:

"Race influences whether youth are processed formally through the juvenile courts or alternatively, processed informally outside of the court after an initial arrest, according to a study of over 1,200 young people in three parts of the country. The odds of being formally processed — and, therefore, having greater contact with the legal system — were 67% higher for Black and Latino youth relative to white youth, after accounting for both legal and other factors."

data snack 16.png

SURVEY REMINDER

Please join us in an exciting opportunity to learn more about the racial equity and diversity work happening in our youth serving organizations across the state. The state Juvenile Detention and Alternative Initiative (JDAI) Race, Equity, Disparity, and Inclusion (REDI) work group in partnership with the Juvenile Justice Institute has developed a survey to capture how communities and agencies in Nebraska are moving this work forward.

If you serve on a team dedicated to racial justice in your community, agency or both please consider taking the time to participate in this survey and forwarding it to others doing youth work. The information gathered will help inform future efforts at collaboration, programming, and potential funding. Thank you for taking a few minutes to share your efforts as we work to address Red in Nebraska.

calendar (002).png

Upcoming event

Visit the JJI booth May 5-7 at the annual Nebraska Juvenile Justice Association Conference in Kearney.

Data Snacks: Chronic Absenteeism Among Students

Data from the Nebraska Department of Education indicates that chronic absenteeism is becoming a persistent issue among students in our state.
In fact, Nebraska court data indicates an elevated number of truancy cases filed in court over the past 5 years.
Legislative Bill 568, introduced by Senator Pansing-Brooks will not allow truancy cases to be a delinquency eligible filing.
Community-based services will need to be identified to address the absenteeism.

Data Snacks15.jpg

Data Snacks: Where Referrals Come From

If you’ve ever eaten at a little-known restaurant, or shopped at a small business, someone working there might ask you where you heard of the place. For business owners, it’s useful to know where customers and patrons are coming from, and what markets they might be missing out on. 

Public services and programming are no different. While developing programming to help youth, knowing how youth are finding out about the program is invaluable data to collect. The table below is from our report covering truancy programs, where we took a close look at where referrals to those programs came from. As you can see, almost 80% of the time, youth were referred to the program from a school. The county attorney had not yet been involved in those cases. 

table_truancy.PNG

The data here can give program coordinators some insight into who already knows about their program and services, and who doesn’t. Information like this can be used in a variety of ways. For one, if a truancy program tried different methods of reaching parents, they could look at the data through time to see if their outreach strategy is working or not. Where referrals come from can also provide insight into when youth are receiving interventions. In the example above, the county attorneys were not involved as much in referring, which could imply that youth are receiving intervention before getting deeper into the juvenile justice system.  

The JJI has released a number of reports looking deeply into specific program types, and in many of these, we have presented data about referral sources. We encourage you to take a look through these and see what implications they could have for your program type! 

Data Snacks: Developing Habits and Making Resolutions

It’s a new year, and with it, people try to make changes in their lives. Resolutions can help people figure out their priorities, and they give us a handy excuse to try new things. Maybe one of your resolutions is to make more home-cooked meals. With that in mind, you might try out different recipes to help accomplish your goals.

Of course, resolutions are also infamously tough to stick to and carry out. It’s hard to commit to changes, whether they’re big or small. Modifying our habits takes work, and requires accountability to ourselves. It can take anywhere between 20 to 250 days to develop a habit to begin with, and about 2 months for the behavior to become automatic. That's a lot of time to set aside for that work, and it's easy to mess up! Breaking a habit also takes about two and a half months for the average person, if it's something you want to stop doing.

checklist.jpg
support.jpg

Motivation can help with the process of developing a habit. To cook more at home, you might be motivated externally, since you can save money by cooking instead of eating out. You may also feel intrinsically motivated—there’s nothing more satisfying than serving a delicious meal to yourself and your loved ones.

When it comes to helping youth make changes in their lives—whether by attending school, or getting involved in their communities, or saying “no” to drugs—it’s useful to consider the different ways you can help youth accomplish those goals. What methods will help youth keep track of their goals and progress? Who are youth accountable to for their actions? How can your programs motivate youth? Considering that many youth may have made certain actions into habits, it can take a lot of time and support to change that behavior for the better.

Resolutions and making big changes in life are difficult, but with the right strategy, motivation, and support networks, anything is possible!

Data Snacks: Racial and Ethnic Disparity in Nebraska

One timely and important topic in justice at all levels is racial and ethnic disparity. This concept basically means that people of color are disproportionately drawn into the justice system. To put it concretely, a Black person is more likely to be arrested than a White person for the same offense. The UNO School of Criminology and Criminal Justice released a report about this exact problem in Nebraska, which you can read by following this link.

The data in this report is sobering and disappointing. From the chart below, you can see that Black Nebraskans make up 5% of the population of Nebraska, yet account for nearly 20% of the total arrests. Although this report looks at the criminal justice system as a whole, juvenile justice system data reflects similar pattern in many of Nebraska’s counties.

ds9_graph.PNG

When someone is arrested, that person’s arrest affects everyone around him: family, friends, coworkers, children, and so on. The person who’s arrested may be a mentor in her community whose presence matters to the kids in her neighborhood. Children who witness their parents getting arrested may also be traumatized by the event.

Many people in Nebraska are working to address rail and ethnic disparity and underlying address systemic racism in our communities. As we move forward, consider ways you can help make your community an equitable and just place for everyone. 

Data Snacks: Where We Live

Have you ever considered the influence of homeownership while developing programs and interventions for youth? At first blush, it might not seem clear how the number of homeowning families versus renting families could affect the youth that much. However, where people live has big implications on all factors that could influence a person's life. Lancaster county, for example, has the biggest percentage of renters in the state of Nebraska, at 40%.

ds8_infographic.png

According to Census data, in Lancaster, 40% of people rent their homes. The national average of renters in the United States is just shy of 30%, so Lancaster has significantly more renters.

What can this change about a young person's life? For one thing, homeownership offers wealth, security, and greater autonomy to a family. The neighborhood where someone lives also reflects their school district, and wealthier schools can offer more resources than poorer districts, where renters tend to live.

Safety is a big factor influencing youth, too--in some areas in town, it might be perfectly fine to go for a walk during the evening, while in other neighborhoods, doing so might be riskier. A person's health is also influenced by their neighborhood. What if the closest grocery store to your home had a lacking selection of fresh fruits and vegetables? What if living in a noisy neighborhood with high traffic prevented someone from getting a full night of sleep regularly?

As you work with and serve youth, it can be useful to know what basic necessities people have available to them in their neighborhoods. Search for gaps or barriers people might encounter based on where they can afford to live, and you can help find or create a solution to address those problems.

Data Snacks: What We Don't Know

Data can be scary! Sometimes when we see numbers, we understand their implications--like a decreased budget. When we don't know what the numbers mean, that can also be concerning. If you've ever had your doctor explain what a certain lab result means, you might already be familiar with that uncomfortable, confusing feeling.

What can be even worse is when you can't get those numbers to begin with. What if you found a new food at the grocery store and brought it home, only to discover there was a big blank spot where the ingredient list should be? If you have any allergies or dietary restrictions, you probably wouldn't want to eat that food.

Sometimes, though, you don't have much of a choice in the issue. Various organizations, including state agencies and other entities, sometimes don't collect data, or don't readily make it available for the researchers, program coordinators, and the public in general.

The table below shows some concerning gaps in the data. As you can see, we have statistics at the state level on the race(s) of youth who are offered diversion and enroll. But we don't actually know how many youth are stopped by law enforcement to begin with, or how many are taken into temporary custody. If we did have clear numbers, what sort of story would they tell? How could we use that information to better serve our communities?

missing_folder.png
nutrition label_ds7.png

In the upcoming month you may be asked to look at the data in your community needs assessment. If you do not get good data, it will be hard to tell what your community really needs. As we begin the planning process, consider what data is missing, and how we may able to get the data we need to help create better outcomes for the youth we work with.

Data Snacks #6: Considering Options

As counties beginning their planning process, the Juvenile Justice Institute will be by your side as you work your way through the options. However, in a healthy approach, one should ideally eat what their body needs – not simply what we crave. 

noun_Nutrition_1884278.png

If you have low iron, eat a steak or some quinoa! But if you have trouble absorbing iron, you need to add some green leafy spinach to help you meet the goal. That spinach can absorb more easily into your body, and it's vegetarian-friendly and can be more affordable than steak or quinoa, too.

Similarly, your community has unique needs, and you should tailor your programs to meet those needs. 

noun_resources_901632.png

If your community has a large number of 1st time diverse offenders – who are not enrolling in diversion, you may need to address why they aren't enrolling. Everyone has different challenges to overcome in their lives, and the youth served are no different.

If a young person doesn't have reliable transportation to get to diversion programs, consider how you can provide that resource to them. Free bus passes may help, or if your community does not have public transportation, working with leaders to build that infrastructure may also be a solution. Some youth might not be able to afford diversion, especially if there's a high fee associated with it, so a scholarship for these kids may boost enrollment--or nixing fees altogether. 

Most problems we encounter in life have multiple possible solutions. Some solutions are better than others for all sorts of reasons - timeliness, the realities of funding, or the people-power we can turn to in our network. As counties develop their community plans, the JJI will help you identify your needs, so you can consider your options.

noun_human resources_899375.png

Data Snacks #5: The Program Buffet

Many communities in Nebraska are gearing up for community planning.  Too often we approach community planning like a buffet – we heap on piles of food, and end up not eating it all.  Similarly, some of the programs funded through CBA were not utilized as much as others.

ds5_types.png

This planning cycle, we hope to work closely with communities, to tailor what they want on their plate.  We will work in each of your communities, using a community needs assessment, to map interventions.  It is a little like stopping to think, “what am I craving?” then selecting that exact dish before your plate gets overwhelmed with food. We hope that this process helps you plan exactly what services your community needs!

Data Snacks #4: Distance and Services

data_snacks_logo_small.png

Ideally, we should be examining data about our programs and using it to shape and make changes to the program.  Relevant data is vital to the success of your program. 

For example, if you owned a pizza company and you knew your delivery drivers had to drive an average of 46 miles to deliver the pizza, what would you do?

In Nebraska, mental health providers drive this far every day to deliver services way more important than pizza! The graphic below indicates how far providers needed to travel in order to meet with youth or do related work. This was taken from our Mental Health Brief, released June 2020, but the message can be applied to other program types!

data_snacks_3_drive.png

Can you imagine how a youth's situation would improve if services were more readily available in her community? What if a student struggling with mental health issues could walk into a safe environment just a few blocks away from his home to get support? Imagine how much the youth in our towns and cities would benefit from having more readily-available services!

Finally, thank you to those who responded to the survey last time! You can expect to see the data from that survey in a future snack. We also want to congratulate Leanne M. as our randomly-drawn winner of the $25 Amazon gift card. 

Data Snacks #3: Getting on the Scale

data_snacks_logo_small.png

Changing our behavior based upon data is not new!  Every week that I get on the scale, I change my behavior based upon that number.  Then by lunch, I’m eating a cookie! 🍪

ds3_scale.png

Based on last week’s survey, those of you who are using the scale are doing so regularly (weekly and monthly) and it shows! Whoo-hoo! 

70% of you reported changing part of your program, while the remaining 30% changed a policy.

However, it appears that most of you are not even getting on the scale! I know we all get too much junk (food) in our boxes, so I am going to incentivize this week’s version of data snacks. ANYONE who answers the survey this week (must include your name) will be entered into a drawing to win a $25.00 Amazon gift card (delivered to your inbox).

To be eligible, you need to get on the scale and answer the survey. Your answers to the questions in the survey will remain anonymous, and a screen after the survey will collect your email address separately so we can get into contact with you should you win!

Note. Since this is an old Data Snack, the gift card raffle is now closed. To receive Data Snacks in your inbox—which may include additional incentive surveys—you can sign up here.

Data Snacks #2: How Do You Use Data?

data_snacks_logo_small.png

Do reports from the Juvenile Justice Institute feel like an 8 course meal where you feel a little nauseous by the end? Or maybe you just can’t even finish? Last year we rolled out our briefs, and have heard that even those might still be a little too much to digest in one sitting!

In our last email, the survey asked a few questions. We're happy to say that no respondent said they don't read either our reports or our briefs!

data_snacks_2_reports.png
data_snacks_2_briefs.png

We also wanted to know why people opened up and read our reports, so here are some of the responses from that part of the survey. The bigger the word/phrase, the more often it showed up in the survey responses!

data_snacks_2_cloud.png

While we cannot completely go against our nature (i.e. we will continue to be data geeks that yammer on with lots of words and graphs!) we DO want to help you be as excited about data as we are.

Please recall that we will be emailing you these tasty tidbits every other Wednesday, unless you opt out.

And because we love data—we will ask you a few questions along the way, as well. If you checked out the survey from the last Data Snack, you'll see your response represented in the graphics above. To take the second Data Snacks survey, you can follow this link. We appreciate your response!

Come enjoy a data snack with JJI. To sign up for future Data Snacks, simply fill out this short form.